Physics graphs are powerful tools for visualising and understanding data. Whether it involves motion, forces, or energy, graphs reveal patterns and relationships that might otherwise be difficult to spot. However, many students find graphs challenging to interpret or create. This guide will break it down into manageable chunks, helping you become confident in handling physics graphs.
- Distance-time graphs: Time is on the x-axis, and distance is on the y-axis.
- Velocity-time graphs: Time is on the x-axis, and velocity is on the y-axis.
Make sure to check the labels and units on the axes before interpreting or plotting any graph.
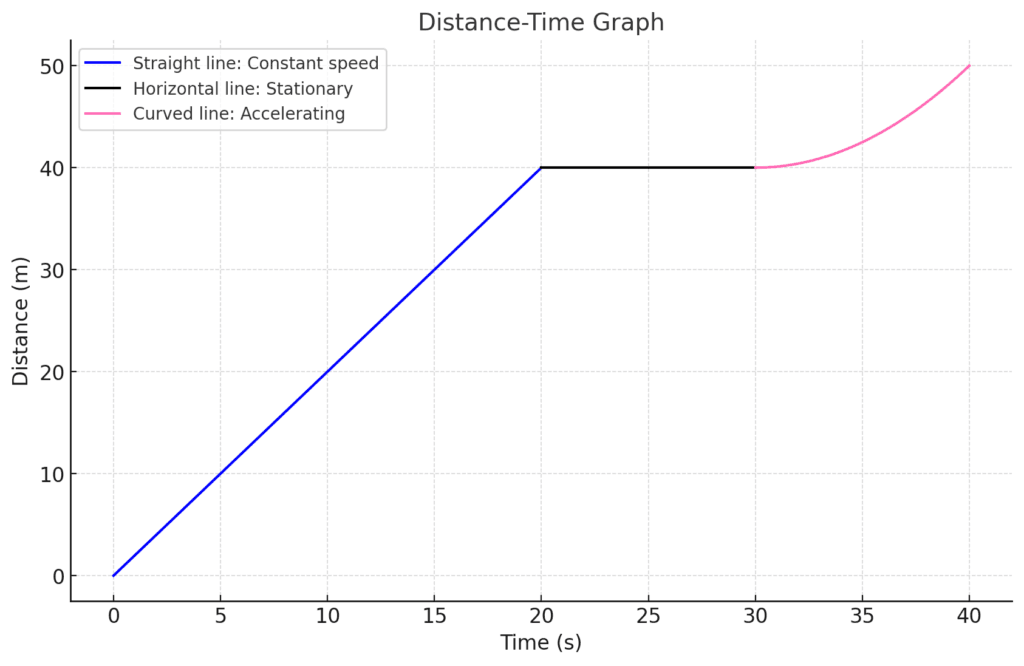
For distance-time graphs
- Horizontal line: A horizontal line indicates constant velocity. The object is moving at the same speed without acceleration.
- Sloping line: A sloping line shows acceleration (if the line slopes upwards) or deceleration (if it slopes downwards).
- Area under the graph: The area under the line represents the distance travelled. Calculating this area can help you determine how far the object has moved.
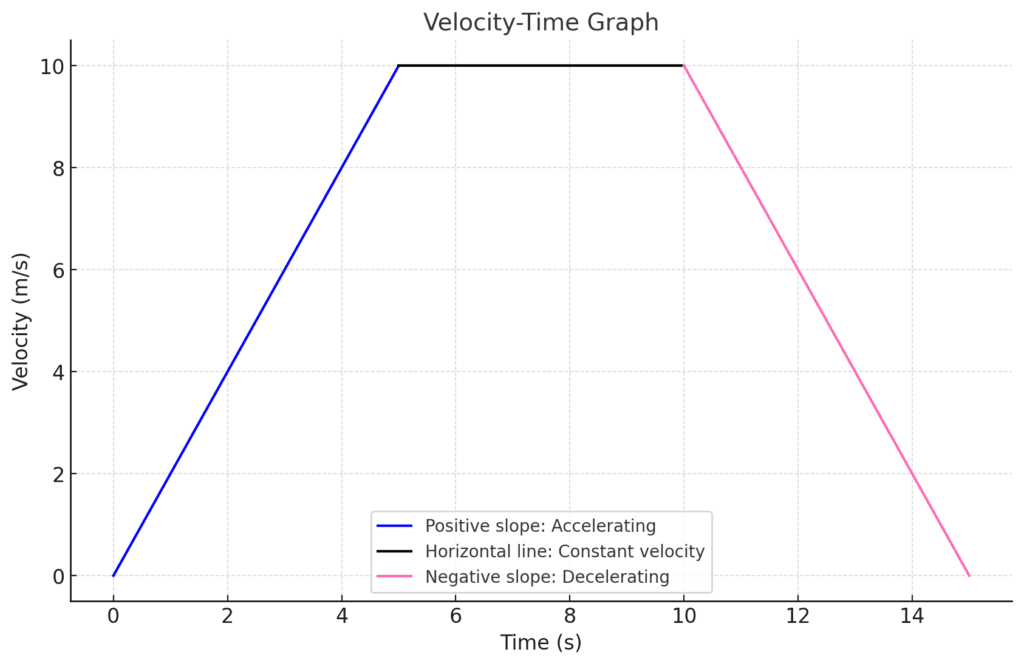
Velocity-time graphs
For velocity-time graphs, the slope of the line gives you the acceleration of the object:
Horizontal line shows the object is travelling at a constant velocity
Positive slope means the object is speeding up
negative slope indicates the object is slowing down
Misinterpreting Axes: Double-check the labels and units on each axis. Mixing up time, distance, and velocity can lead to incorrect conclusions.
- Skipping Axis Labels: Always label the axes when drawing a graph. This step is essential for clarity and can cost marks if skipped in exams.
- Drawing Incorrect Lines: A straight line that appears curved or a sloping line that looks uneven might indicate an error in your data or method. Double-check your calculations and ensure your tools are accurate.
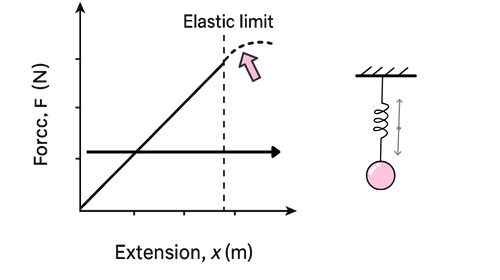
A force is required to accelerate and decelerate objects. Find out more about how Forces are used in our world here: https://physicsforgirls.com/why-understanding-forces-will-make-you-a-physics-pro/
- Practise Regularly: Use past exam questions to practise drawing and analysing different types of graphs. This will help you become more familiar with various scenarios.
- Sketch First: Before plotting data points precisely, sketch a rough version of the graph to visualise its shape.
- Use Proper Tools: Ensure you have a sharp pencil, a ruler, and graph paper for neat and accurate graphs.
- Focus on Trends: Pay attention to overall patterns in the graph rather than getting stuck on individual points.
- Desmos: This online graphing calculator is perfect for plotting data and experimenting with different graphs.
- BBC Bitesize: Offers interactive lessons and examples specifically tailored to physics graphs.
- Your Textbook: Most physics textbooks include sections on graph interpretation with example questions and solutions.